
| Rudy Flores · (619) 392-6714 · Real Estate Strategist, Realtor® · CalDRE #02257808 · Responsible Broker CalDRE #01481919
REAL ESTATE EASTLAKE
Seller Scorecard

EastLake & Bonita Seller Scorecard: Monthly Numbers

Each month's housing numbers for the EastLake, Otay Ranch and Bonita ZIP codes, side by side, plus a picture of the month and a spreadsheet of every month.

SELLER SCORECARD · NOVEMBER 2026

Around here “EastLake” covers a lot of Chula Vista, so this scorecard takes in the three ZIP codes around EastLake and Otay Ranch (91913, 91914, 91915) and Bonita next door (91902). Rancho Del Rey's ZIP 91910 has its own card on REYLIST8. Here is September 2026.

Thinking of selling in EastLake, Otay Ranch or Bonita? Start with the Home Strategy Quiz; a few taps tell Rudy enough to map out a plan for your place.

Take the Home Strategy Quiz
This month

How September 2026 went, ZIP by ZIP

Zillow's monthly numbers for each ZIP code, then the weekly metro readings below the table.

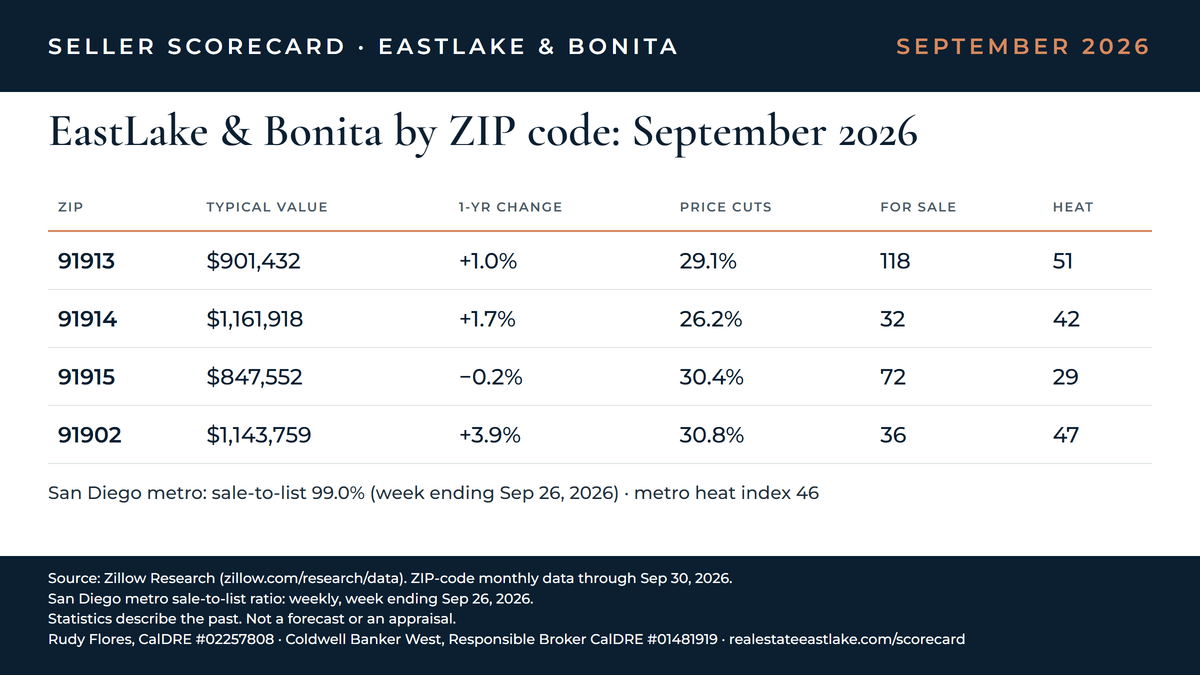
EastLake, Otay Ranch and Bonita ZIP codes, September 2026
ZIP codeTypical homePast yearPrice cuts (last year)Listings (last year)Heat index
ZIP 91913parts of EastLake and Otay Ranch$901,432+1.0%29.1% (31.7%)118 (149)51
ZIP 91914parts of EastLake$1,161,918+1.7%26.2% (n/a)32 (40)42
ZIP 91915parts of Otay Ranch$847,552−0.2%30.4% (31.6%)72 (92)29
ZIP 91902Bonita$1,143,759+3.9%30.8% (25.0%)36 (38)47

Across the San Diego metro, homes sold at 99.0% of their last asking price on average in the seven days to Sep 26, 2026 (98.7% the same week last year), and the metro heat index came in at 46.

Looking back

Two years of typical values here

A line for each of the four ZIP codes, from Zillow's monthly index.

Typical home value, last 24 monthsZillow typical home value for ZIP 91913, ZIP 91914, ZIP 91915, ZIP 91902, Oct 2024 to Sep 2026.$800K$900K$1M$1.10M$1.20MOct ’24Feb ’25Jun ’25Oct ’25Feb ’26Jun ’26

ZIP 91913ZIP 91914ZIP 91915ZIP 91902

View the numbers
Typical home value by month
MonthZIP 91913ZIP 91914ZIP 91915ZIP 91902
Sep 2026$901,432$1,161,918$847,552$1,143,759
Aug 2026$898,784$1,157,476$845,948$1,139,564
Jul 2026$896,265$1,152,697$844,380$1,135,509
Jun 2026$895,023$1,150,973$844,311$1,131,754
May 2026$894,621$1,149,528$844,845$1,128,035
Apr 2026$894,660$1,148,405$845,479$1,122,799
Mar 2026$894,467$1,147,029$845,682$1,117,645
Feb 2026$894,152$1,146,725$846,178$1,113,846
Jan 2026$892,926$1,145,909$846,165$1,110,648
Dec 2025$891,374$1,144,335$845,698$1,107,677
Nov 2025$890,195$1,142,191$845,632$1,103,732
Oct 2025$890,974$1,141,282$846,837$1,101,529
Sep 2025$892,821$1,142,324$848,979$1,100,386
Aug 2025$895,632$1,145,744$852,152$1,100,011
Jul 2025$898,376$1,150,914$855,716$1,101,313
Jun 2025$901,846$1,156,147$859,728$1,102,302
May 2025$905,942$1,160,674$863,351$1,103,928
Apr 2025$910,983$1,165,200$867,228$1,104,058
Mar 2025$914,051$1,167,988$869,312$1,104,032
Feb 2025$915,903$1,169,577$870,849$1,105,331
Jan 2025$915,359$1,168,879$870,900$1,106,748
Dec 2024$913,659$1,166,209$870,424$1,108,235
Nov 2024$910,947$1,162,508$869,171$1,108,813
Oct 2024$908,742$1,158,407$868,445$1,109,352
The chart

September 2026 in a picture

All four ZIP codes and the metro numbers on one image, with the source on it.

EastLake & Bonita Seller Scorecard, September 2026: ZIP 91913 typical home value $901K (+1.0% in a year), 29.1% of listings with a price cut, 118 homes for sale, Zillow market heat index 51; ZIP 91914 typical home value $1.16M (+1.7% in a year), 26.2% of listings with a price cut, 32 homes for sale, Zillow market heat index 42; ZIP 91915 typical home value $848K (−0.2% in a year), 30.4% of listings with a price cut, 72 homes for sale, Zillow market heat index 29; ZIP 91902 typical home value $1.14M (+3.9% in a year), 30.8% of listings with a price cut, 36 homes for sale, Zillow market heat index 47; San Diego metro sale-to-list 99.0%, week ending Sep 26, 2026, metro heat index 46. Source: Zillow Research.
Numbers from Zillow Research (ZIP figures monthly, metro figures weekly), put together by Rudy Flores of Coldwell Banker West, CalDRE #02257808. realestateeastlake.com/scorecard

If you quote these numbers

Numbers from Zillow Research (ZIP figures monthly, metro figures weekly), put together by Rudy Flores of Coldwell Banker West, CalDRE #02257808. realestateeastlake.com/scorecard

For reporters and editors

Embed code

Download the chart (PNG, 1200 × 675)

Free to republish with the source line and link kept with it. Please don't crop the source line, change the numbers, or present them as a forecast. Zillow is cited as the data source; Zillow did not prepare or endorse this scorecard.

For a local comment, call or text Rudy at (619) 392-6714 or email [email protected].

The five numbers in plain words

  • Typical home. Zillow's middle-of-the-road value for the ZIP code: homes from the 35th to the 65th percentile, single-family and condo alike, with seasonal swings smoothed out.
  • Price cuts. How many of the month's listings ended the month at a lower asking price than they started it with, as a percentage.
  • Listings. The number of homes listed at any point in the month, each counted once.
  • Heat index. Zillow's read on supply versus demand. When the number is higher, conditions favor sellers more.
  • Sale-to-list. Sale price as a percentage of the last asking price, averaged over a week across the San Diego metro; Zillow does not break it out by ZIP code.

The ZIP numbers come out monthly. Sale-to-list is weekly and covers the metro area, since that is the only way Zillow publishes it.

Definitions, checked Nov 5, 2026: Zillow Research, Housing Data.

How does your home compare?

Back months

Every month so far

Open a ZIP code to see each month the way it was first posted.

ZIP 91913 (parts of EastLake and Otay Ranch)
ZIP 91913, month by month
MonthTypical homePast yearPrice cutsListingsHeatMetro sale-to-list
Sep 2026$901,432+1.0%29.1%1185199.0%
Aug 2026*$898,784+0.4%29.8%1265499.2%
Jul 2026*$896,265−0.2%27.2%1266299.4%
Jun 2026*$895,023−0.8%22.2%1184399.4%
May 2026*$894,621−1.2%17.4%1106799.3%
Apr 2026*$894,660−1.8%16.7%1027699.5%
Mar 2026*$894,467−2.1%19.7%936999.4%
Feb 2026*$894,152−2.4%19.7%885999.1%
Jan 2026*$892,926−2.5%19.3%925998.8%
Dec 2025*$891,374−2.4%22.6%1025998.6%
Nov 2025*$890,195−2.3%26.3%1197098.7%
Oct 2025*$890,974−2.0%31.7%1343198.7%
Sep 2025*$892,821−1.7%31.7%1494898.7%
ZIP 91914 (parts of EastLake)
ZIP 91914, month by month
MonthTypical homePast yearPrice cutsListingsHeatMetro sale-to-list
Sep 2026$1,161,918+1.7%26.2%324299.0%
Aug 2026*$1,157,476+1.0%23.7%355499.2%
Jul 2026*$1,152,697+0.2%25.0%405399.4%
Jun 2026*$1,150,973−0.4%22.5%465799.4%
May 2026*$1,149,528−1.0%22.1%476599.3%
Apr 2026*$1,148,405−1.4%20.3%376599.5%
Mar 2026*$1,147,029−1.8%15.2%276399.4%
Feb 2026*$1,146,725−2.0%21.1%196899.1%
Jan 2026*$1,145,909−2.0%n/a196498.8%
Dec 2025*$1,144,335−1.9%n/a226098.6%
Nov 2025*$1,142,191−1.7%n/a296898.7%
Oct 2025*$1,141,282−1.5%n/a353898.7%
Sep 2025*$1,142,324−1.3%n/a404198.7%
ZIP 91915 (parts of Otay Ranch)
ZIP 91915, month by month
MonthTypical homePast yearPrice cutsListingsHeatMetro sale-to-list
Sep 2026$847,552−0.2%30.4%722999.0%
Aug 2026*$845,948−0.7%28.3%735199.2%
Jul 2026*$844,380−1.3%27.7%744299.4%
Jun 2026*$844,311−1.8%27.8%704599.4%
May 2026*$844,845−2.1%25.1%635399.3%
Apr 2026*$845,479−2.5%19.8%594599.5%
Mar 2026*$845,682−2.7%13.6%576699.4%
Feb 2026*$846,178−2.8%12.2%587699.1%
Jan 2026*$846,165−2.8%15.2%587398.8%
Dec 2025*$845,698−2.8%20.2%656798.6%
Nov 2025*$845,632−2.7%28.2%754898.7%
Oct 2025*$846,837−2.5%30.3%864698.7%
Sep 2025*$848,979−2.4%31.6%923198.7%
ZIP 91902 (Bonita)
ZIP 91902, month by month
MonthTypical homePast yearPrice cutsListingsHeatMetro sale-to-list
Sep 2026$1,143,759+3.9%30.8%364799.0%
Aug 2026*$1,139,564+3.6%33.0%395099.2%
Jul 2026*$1,135,509+3.1%29.6%404599.4%
Jun 2026*$1,131,754+2.7%23.3%375099.4%
May 2026*$1,128,035+2.2%20.3%345399.3%
Apr 2026*$1,122,799+1.7%20.7%326199.5%
Mar 2026*$1,117,645+1.2%24.3%316399.4%
Feb 2026*$1,113,846+0.8%21.9%296799.1%
Jan 2026*$1,110,648+0.4%22.7%286098.8%
Dec 2025*$1,107,677−0.1%19.2%315698.6%
Nov 2025*$1,103,732−0.5%22.3%354998.7%
Oct 2025*$1,101,529−0.7%20.4%373898.7%
Sep 2025*$1,100,386−0.9%25.0%383798.7%

* Filled in on Nov 4, 2026 from that day's Zillow files, so the record starts a full year back.

Download all the months (CSV)

The monthly EastLake updates: September 2026, August 2026, July 2026, June 2026.

Nearby and beyond

More scorecards from Rudy

Same five numbers, other parts of the county.

Good questions

Common questions

Is this telling me where prices are headed?

No. Every figure is about a month or week that is already over. It shows where things stood, nothing more.

Why do all four ZIP codes share one sale-to-list number?

Zillow only puts out sale-to-list for metro areas, so the San Diego metro figure is the closest one there is.

When do new numbers show up?

Right after Zillow's monthly release; the September 2026 files went up Oct 16, 2026. Once a month is posted here, its numbers stay put.

Where is Rancho Del Rey?

ZIP 91910 has its own monthly card, the Rancho Del Rey 91910 Seller Scorecard on REYLIST8, so this page sticks to 91913, 91914, 91915 and 91902.

Can I share the EastLake and Bonita chart?

Yes, when the source line and the link travel along with it. The reporters section above lists the terms.

Curious how your own place stacks up? The Home Strategy Quiz is the quickest way to get Rudy's take on it.

Take the Home Strategy Quiz

From Zillow Research. These numbers describe the past for whole ZIP codes and the metro area; none of them values a particular home or says where prices go next.

Thinking About Selling Around EastLake?

Rudy can walk you through how your home compares with this month's numbers, no pressure.

Get In Touch